Introduction Match The Geologic Diagram
Matching Geologic Diagram Types with Their Descriptions, Geologic diagrams play a crucial role in understanding the complex processes that shape our planet's surface and subsurface. These visual representations help geologists and scientists communicate their findings and interpretations effectively. In this article, we will delve into various types of geologic diagrams and match them with their respective descriptions, shedding light on their significance in unraveling Earth's history.
Stratigraphic Column
Description: A stratigraphic column is a vertical representation of rock layers or strata found in a specific location. It displays the chronological sequence of sedimentary rocks, fossils, and other geological features. Each layer represents a different period in Earth's history, providing insights into the changes that have occurred over time.
Importance: Stratigraphic columns are essential for reconstructing the geological history of a region, identifying major events such as mass extinctions or shifts in sea levels, and aiding in the correlation of rock layers across different areas.
Cross-Section Diagram
Description: A cross-section diagram illustrates the internal structure of the Earth's crust by cutting through it vertically. It helps visualize the various rock formations, faults, folds, and other geological features that may not be visible on the surface.
Importance: Cross-section diagrams provide a 3D perspective of the subsurface, enabling geologists to understand the intricate geological processes that have shaped landscapes and contributed to the formation of natural resources.
Geologic Map
Description: A geologic map represents the distribution of different rock types, minerals, and geological structures across a specific area. It uses symbols and colors to denote different formations and their characteristics.
Importance: Geologic maps aid in land-use planning, resource exploration, and hazard assessment. They help identify potential locations for mining, construction, and infrastructure development by highlighting the geologic characteristics of a region.
Fossil Record Diagram
Description: The fossil record diagram showcases the evolutionary history of life on Earth through the identification of fossils found in various rock layers. It helps scientists track the changes in species over time and provides insights into the development of ecosystems.
Importance: Fossil record diagrams contribute to our understanding of the Earth's biological history, including the emergence and extinction of species, and help researchers make connections between different periods in geologic time.
Volcano Diagram
Description: A volcano diagram illustrates the internal structure of a volcano, showcasing its various components such as the magma chamber, conduit, vent, and crater. It may also indicate the types of eruptions associated with a particular volcano.
Importance: Volcano diagrams assist in the study of volcanic processes, eruption predictions, and hazard assessments. Understanding the inner workings of volcanoes is crucial for mitigating the risks posed by volcanic activity.
Rock Cycle Diagram
Description: The rock cycle diagram illustrates the continuous processes of rock formation, transformation, and recycling on Earth. It depicts how igneous, sedimentary, and metamorphic rocks can change from one type to another over geological time scales.
Importance: The rock cycle diagram helps geologists grasp the interconnected nature of different rock types and their interactions within Earth's dynamic systems. It underscores the cyclical nature of geological processes.
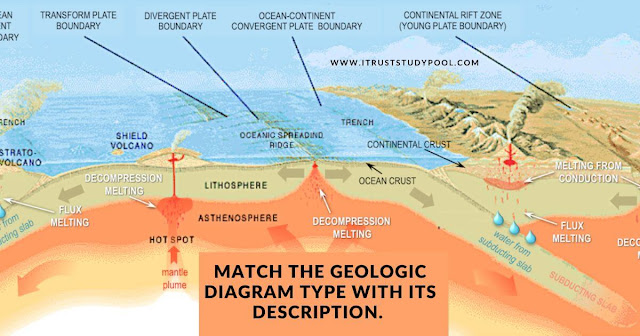
Plate Tectonics Diagram
Description: A plate tectonics diagram visualizes the movement and interaction of Earth's tectonic plates, including divergent, convergent, and transform boundaries. It showcases the distribution of earthquakes, volcanoes, and mountain ranges along plate boundaries.
Importance: Plate tectonics diagrams provide a foundation for understanding the formation of continents, ocean basins, and geological hazards. They help explain the processes that shape landscapes and drive geological activity.
Conclusion
Geologic diagrams serve as powerful tools for geologists and scientists to interpret and communicate the intricate processes that have shaped our planet over billions of years. From illustrating the history of rock layers to explaining the movements of tectonic plates, these diagrams provide visual insights into the dynamic nature of Earth's geology. By matching each diagram type with its description, we've highlighted their significance in unraveling the mysteries of our planet's past and present.


Post a Comment